


Related Insights

Harnessing Technology in the Oil and Gas Industry to Respond to Global Challenges

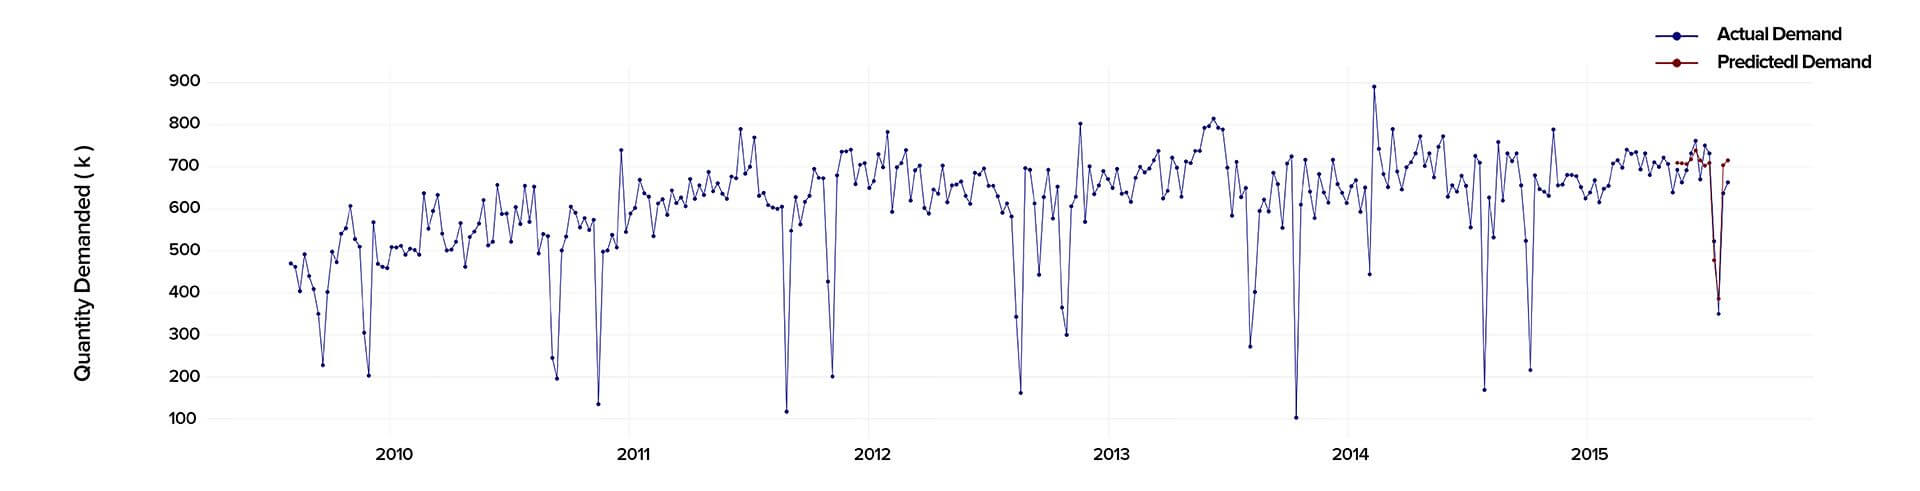
AI in Supply Chain: A Real-world Case Study on Harnessing AI’s Potential

Breaking it Down: MLOps vs DevOps – What You Need to Know

Providing Data Science Expertise to Help Edge AI Startup Mature and Meet Market Demand

A Future of Smart Finance: Exploring AI and ML in Banking and Insurance

Harnessing the Power of Behavioural Data Analytics in the Insurance Industry

AI Revolution in Healthcare: Exploring the Applications and Benefits

Powering AI: Exploring the Best Programming Languages for Machine Learning

Unlocking the Potential: Mastering the Art of AI System Development

Edge Computing: Enhancing Real-Time Data Processing and Analysis in Healthcare

Agile Product Management: Navigating the Dynamic Landscape of Software Development

E-commerce Tech Trends: Reinforcement Learning for Dynamic Pricing